Technical Analysis of the Markets for swing trading stocks
Technical Analysis of the Markets for swing trading stocks Technical analysis for swing trading stocks is a crucial tool for traders and investors. Whether you’re a novice or a seasoned pro, mastering this technique can significantly enhance your trading strategy. This blog post will delve into the fundamentals of technical analysis, its key concepts, and … Continue reading "Technical Analysis of the Markets for swing trading stocks"

Technical Analysis of the Markets for swing trading stocks
Technical analysis for swing trading stocks is a crucial tool for traders and investors. Whether you’re a novice or a seasoned pro, mastering this technique can significantly enhance your trading strategy. This blog post will delve into the fundamentals of technical analysis, its key concepts, and how to apply it effectively. First we need to open tradingview.com and start further reeding for better experience
What is Technical Analysis analysis for swing trading stocks ?

Technical analysis involves evaluating securities by analyzing statistical trends from trading activity, such as price movement and volume. Unlike fundamental analysis, which focuses on a company’s financial health and economic factors, technical analysis primarily uses historical price data and market statistics to forecast future price movements.
Key Components of Technical Analysis
Technical analysis is based on three core principles:
1. Price Discounts Everything: According to this principle, all information, both public and private, is already reflected in the stock price.
2. Price Moves in Trends: Technical analysts believe that prices move in trends and that past price movements can help predict future trends.
3. History Tends to Repeat Itself: Market behavior tends to repeat itself over time due to the collective behavior of market participants.
Essential Tools and Techniques in Technical Analysis
To effectively analyze market trends, traders use various tools and techniques. Here are some of the most commonly used:
1. Charts for swing trading stocks
Charts are mandatory for technical analysis. They visually represent price movements over a specific period and help identify trends. The most popular types of charts include:
Line Charts: Show the closing prices over a specified period.
Bar Chart: Display opening, closing, high, and low prices for each period.
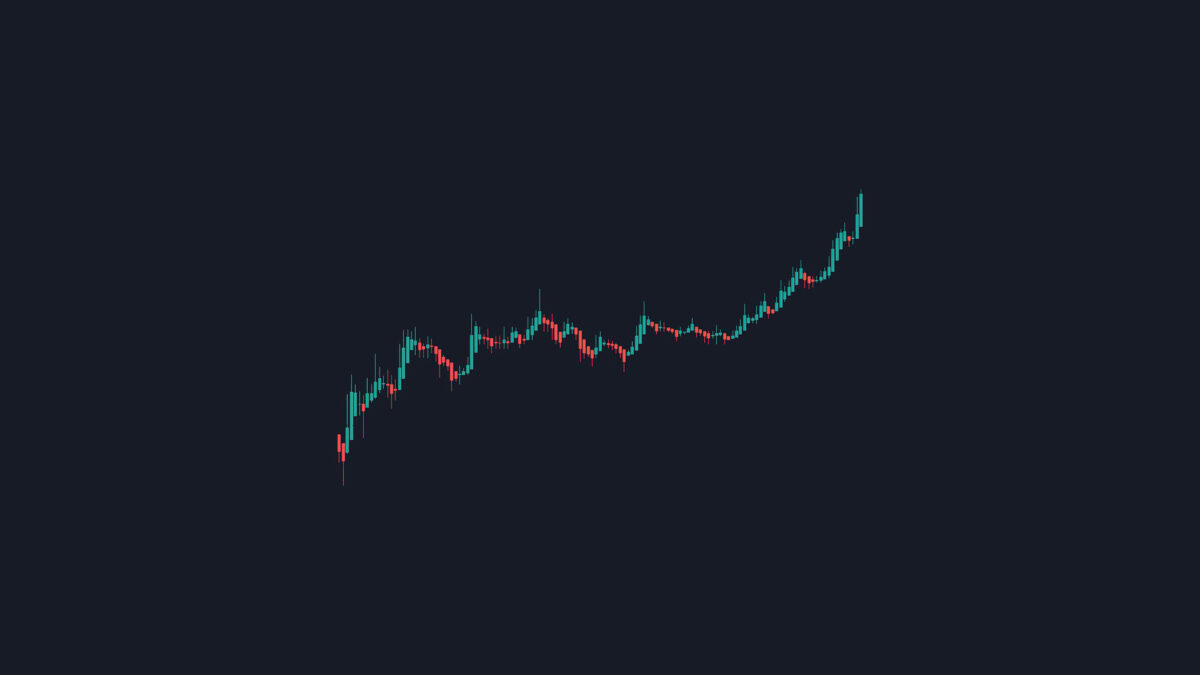
– Candlestick Charts: Provide detailed information about price movement, including opening, closing, high, and low prices for each period. You can find best technical tool in tradingview.com
2. Technical Indicators for swing trading stocks
Technical indicators are mathematical calculations based on historical price, volume, or open interest data. Some widely used indicators include:
Moving Averages: Smooth out price data to identify trends over time.
Relative Strength Index (RSI): Measures the speed and change of price movements to identify overbought or oversold conditions.
MACD (Moving Average Convergence Divergence): Shows the relationship between two moving averages of a security’s price.
3. Trend Lines and Support/Resistance Levels for swing trading stocks
Trend Lines: Help identify the direction of the market by connecting significant highs or lows.
-Support and Resistance Levels: Indicate price levels where a security tends to stop falling (support) or rising (resistance).
4. Chart Patterns for swing trading stocks
Chart patterns help predict future price movements based on historical patterns. Common chart patterns include:
Head and Shoulders
Double Tops and Bottoms
Triangles and Flags
How to Apply Technical Analysis in Your Trading Strategy of swing trading stocks
1. Define Your Goals: Determine whether you are trading for short-term gains or long-term investments.
2. Choose Your Tools: Select the technical indicators and chart patterns that best fit your trading style.
3. Develop a Strategy: Create a trading strategy based on your analysis and back test it to ensure its effectiveness.
4. Monitor and Adjust: Continuously monitor your trades and adjust your strategy based on market conditions. we select and give advise on best stocks in our website mavianalytics.com
Best Practices for Technical Analysis
1. Stay Updated: Keep up with market news and trends to complement your technical analysis.
2. Use Multiple Indicators; Combine different indicators to improve the accuracy of your analysis.
3. Avoid Over-Reliance: Don’t rely solely on technical analysis; incorporate fundamental analysis for a well-rounded view.
Conclusion
Technical analysis is a powerful tool for understanding market trends and making informed trading decisions. By mastering the various tools and techniques discussed, you can enhance your trading strategy and increase your chances of success in the market.  The Relative Strength Index (RSI) measures how fast prices change to find overbought or oversold situations. The MACD shows the relationship between two moving averages of a security’s price.


 Update: Aug 12, 2024
 8 mins
read