The Top 7 Indicators for Swing Trading: Master Your Trades with Precision
The Top 7 Indicators for Swing Trading: Master Your Trades with Precision Swing trading is a popular strategy for traders who aim to capitalize on short- to medium-term price movements. Unlike day trading, which involves opening and closing trades within a single day, swing trading seeks to capture larger price shifts over several days or … Continue reading "The Top 7 Indicators for Swing Trading: Master Your Trades with Precision"

The Top 7 Indicators for Swing Trading: Master Your Trades with Precision
Swing trading is a popular strategy for traders who aim to capitalize on short- to medium-term price movements. Unlike day trading, which involves opening and closing trades within a single day, swing trading seeks to capture larger price shifts over several days or weeks. To succeed in swing trading, it’s essential to use reliable indicators that help you identify potential entry and exit points. In this article, we’ll explore the top 7 indicators for swing trading that can enhance your decision-making process and boost your trading performance.
1. Moving Averages (MA)
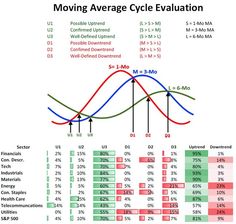
Moving averages are a foundational tool in any trader’s arsenal. They smooth out price data to help traders identify the direction of the trend more easily. There are two main types of moving averages used in swing trading: the Simple Moving Average (SMA) and the Exponential Moving Average (EMA).
Simple Moving Average (SMA): This is calculated by averaging the closing prices over a specific period, such as 50 or 200 days. The SMA is useful for identifying long-term trends. For example, when a stock’s price crosses above its 50-day SMA, it might indicate a bullish trend is forming, and traders could consider entering a long position. On the other hand, a price crossing below the SMA may suggest a bearish trend, signaling traders to either exit their positions or consider shorting.
-Exponential Moving Average (EMA):Unlike the SMA, the EMA gives more weight to recent prices, making it more responsive to new information. This responsiveness is particularly beneficial in short-term swing trading, where traders need to quickly identify changes in momentum. For instance, an upward crossover of the 12-day EMA over the 26-day EMA can serve as a strong buy signal, while a downward crossover might suggest it’s time to sell.
Moving averages are also crucial in constructing other indicators, such as the MACD, which we’ll discuss next. For traders looking to dive deeper into how moving averages can be used, [MaviAnalytics.com](https://mavianalytics.com) provides extensive resources and tools to help refine your strategy.
2. Relative Strength Index (RSI)
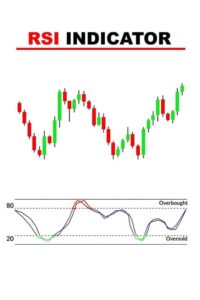
The Relative Strength Index (RSI) is a momentum oscillator that measures the speed and change of price movements. It ranges from 0 to 100 and helps traders identify overbought or oversold conditions in a market.
-Overbought Condition:An RSI above 70 indicates that the asset might be overbought, suggesting a potential pullback or reversal. Swing traders often use this as a signal to sell or tighten stop-loss levels. For instance, if a stock has been on an upward trend and the RSI reaches 75, it might be an early warning that the bullish momentum is losing steam. Some traders might look to pair this signal with other indicators like the MACD to confirm a potential trend reversal.
Oversold Condition: Conversely, an RSI below 30 suggests that the asset might be oversold, indicating a potential buying opportunity. For example, if the RSI drops to 25, it could imply that the stock is undervalued and due for a rebound. Traders can look for signs of a reversal, such as a price crossing above a moving average, before entering a long position.
RSI is also an excellent tool for spotting divergences, where the price moves in the opposite direction to the RSI, often signaling a potential reversal. Platforms like [TradingView](https://tradingview.com) offer customizable RSI settings, allowing traders to fine-tune their analysis according to their trading style.
3. Moving Average Convergence Divergence (MACD)
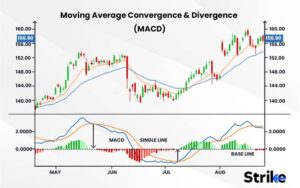
The Moving Average Convergence Divergence (MACD) is a powerful momentum indicator that shows the relationship between two moving averages of a security’s price. The MACD is calculated by subtracting the 26-period EMA from the 12-period EMA. The result is then plotted on a chart, along with a 9-day EMA of the MACD called the “signal line.”
MACD Line and Signal Line: When the MACD crosses above the signal line, it’s considered a bullish signal, suggesting that the price might be going up. This crossover is particularly significant when it occurs below the zero line, as it indicates a strong shift in momentum. Conversely, when the MACD crosses below the signal line, it’s a bearish signal, often leading to a downward trend. Traders use these crossovers to time their entries and exits effectively.
Histogram:The histogram represents the difference between the MACD line and the signal line. When the bars on the histogram are above the zero line, it indicates bullish momentum, and when below, it indicates bearish momentum. The height and direction of the histogram bars can help traders gauge the strength of the trend. For instance, expanding bars above the zero line suggest increasing bullish momentum, while contracting bars may signal a weakening trend.
MACD is highly versatile and can be used across various timeframes, making it an essential tool for swing traders. For a more in-depth understanding of MACD and its applications in different market conditions, visit [MaviAnalytics.com](https://mavianalytics.com).
4. Bollinger Bands

Bollinger Bands consist of a middle band (usually a 20-day SMA) and two outer bands that are two standard deviations away from the middle band. These bands expand and contract based on market volatility, making them a versatile tool for swing traders.
Upper and Lower Bands: When the price touches or exceeds the upper band, it may indicate that the market is overbought, and a reversal could be imminent. Swing traders often use this signal to take profits or tighten stop-loss orders. Conversely, when the price touches the lower band, it could signal an oversold condition, presenting a potential buying opportunity. The more times the price tests these bands without breaking through, the stronger the signal.
Squeeze:A Bollinger Band squeeze occurs when the bands come close together, indicating low volatility. This is often a precursor to a significant price move, making it a critical signal for swing traders. After the squeeze, a breakout in either direction can lead to substantial gains, especially if confirmed by other indicators like volume or the MACD.
Bollinger Bands are particularly effective in volatile markets, where price swings are frequent and pronounced. They can also be combined with other indicators to confirm signals, providing a more robust trading strategy. For tools that help you set up and analyze Bollinger Bands in real-time, check out [TradingView](https://tradingview.com).
5. Stochastic Oscillator
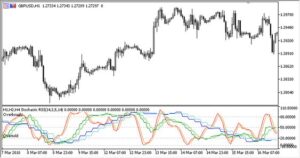
The Stochastic Oscillator is a momentum indicator that compares a particular closing price of a security to a range of its prices over a certain period. The oscillator ranges from 0 to 100, with readings above 80 indicating an overbought condition and readings below 20 indicating an oversold condition.
%K and %D Lines: The Stochastic Oscillator consists of two lines: the %K line and the %D line. When the %K line crosses above the %D line, it’s considered a bullish signal. Swing traders often look for these crossovers when the lines are in the oversold territory, as this can indicate a strong potential for a price reversal. On the flip side, when the %K line crosses below the %D line in the overbought territory, it’s a bearish signal, suggesting that the asset might be due for a pullback.
Divergences: Another valuable aspect of the Stochastic Oscillator is its ability to highlight divergences. A bullish divergence occurs when the price makes a new low, but the oscillator does not, indicating that the downward momentum is weakening. Similarly, a bearish divergence happens when the price makes a new high, but the oscillator fails to do so, signaling a potential reversal.
The Stochastic Oscillator is highly effective in choppy markets, where prices fluctuate within a range. It helps traders identify entry and exit points with greater precision, especially when combined with support and resistance levels. For more advanced strategies involving the Stochastic Oscillator, visit [MaviAnalytics.com](https://mavianalytics.com).
6. Fibonacci Retracement
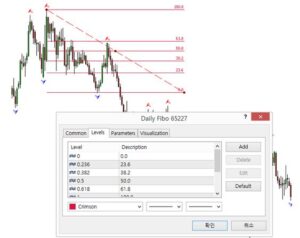
Fibonacci Retracement is a tool that uses horizontal lines to indicate areas of support or resistance at the key Fibonacci levels before the price continues in the original direction. The most commonly used levels are 38.2%, 50%, and 61.8%.
Support and Resistance Levels: These levels help traders identify potential reversal points. For example, if a stock retraces 50% of a previous move, this level might act as support or resistance. Swing traders often use these levels to place limit orders, stop-loss orders, or target prices. For instance, if a stock retraces to the 61.8% level after a strong uptrend, it might present an ideal entry point for a long position, anticipating a continuation of the trend.
Confluence with Other Indicators: Fibonacci levels become even more powerful when they align with other indicators, such as moving averages or previous support and resistance levels. This confluence can increase the probability of a successful trade. For example, if the 50% retracement level coincides with the 200-day moving average, it could represent a strong support level where the price is likely to bounce.
Fibonacci Retracement is widely used in swing trading to predict potential reversal points, allowing traders to set more accurate stop-loss and take-profit levels. Platforms like [TradingView](https://tradingview.com) offer tools to easily draw and analyze Fibonacci levels on your charts, helping you integrate this powerful indicator into your trading strategy.
7. Volume
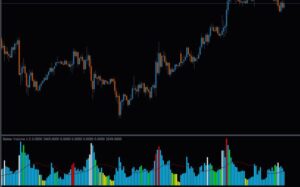
Volume is the total number of shares or contracts traded for a security during a given period. While it’s not a typical indicator, volume plays a crucial role in confirming the strength of a price move.
Volume Spikes: A significant
increase in volume usually accompanies large price movements, signaling the strength of the move. For example, if a stock breaks out of a resistance level on high volume, it’s more likely to be a valid breakout. On the other hand, if the breakout occurs on low volume, it might indicate a false move, and the price could quickly reverse.
Volume as Confirmation: Swing traders use volume to confirm the signals generated by other indicators. For instance, if a stock’s price breaks out above its 50-day SMA and the move is accompanied by a volume spike, it provides stronger evidence that the trend will continue. Conversely, a lack of volume might suggest that the breakout is unsustainable.
Volume analysis is a critical component of any swing trading strategy. It helps traders avoid false breakouts and confirms the strength of price movements. To learn more about how to incorporate volume analysis into your trading strategy, visit [MaviAnalytics.com](https://mavianalytics.com).
Conclusion
Swing trading can be highly profitable if you have the right tools and strategies in place. The top 7 indicators for swing trading discussed above—Moving Averages, RSI, MACD, Bollinger Bands, Stochastic Oscillator, Fibonacci Retracement, and Volume—are essential for identifying trends, spotting reversals, and confirming breakouts. By integrating these indicators into your trading strategy, you can make more informed decisions and increase your chances of success in the markets.
Remember, while these indicators are powerful, they’re not foolproof. It’s important to use them in conjunction with other forms of analysis, such as fundamental analysis or market sentiment, to get a complete picture of the market. Additionally, always practice proper risk management to protect your capital and ensure long-term trading success.
Ready to take your swing trading to the next level? Start incorporating these top 7 indicators into your strategy and watch your trading performance soar! For additional resources and tools, explore [MaviAnalytics.com](https://mavianalytics.com) and [TradingView](https://tradingview.com) to enhance your swing trading experience.


 Update: Aug 22, 2024
 8 mins
read