25 powerful Trading Chart Patterns and Psychology behind Them
Trading Chart Patterns: Understanding Market Psychology and Key Patterns Introduction to Chart Patterns and Market Psychology Trading chart patterns offer a window into the collective psychology of market participants. Each pattern represents a unique battle between buyers (bulls) and sellers (bears), revealing clues about potential trend direction. By recognizing these patterns and understanding the psychology … Continue reading "25 powerful Trading Chart Patterns and Psychology behind Them"

Trading Chart Patterns: Understanding Market Psychology and Key Patterns
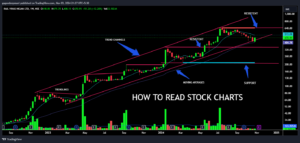
Introduction to Chart Patterns and Market Psychology
Trading chart patterns offer a window into the collective psychology of market participants. Each pattern represents a unique battle between buyers (bulls) and sellers (bears), revealing clues about potential trend direction. By recognizing these patterns and understanding the psychology driving them, traders can make more informed decisions. This blog will provide insights into 25 essential chart patterns, with an in-depth focus on the psychology behind each. You can use the charting tool http://tradingview.com to practice these patterns as practice makes permanent.
Reversal Patterns: Signaling a Change in Market Direction
Reversal patterns are signals that the current trend is weakening and that a potential shift in direction may be imminent. These patterns often appear at the top or bottom of trends, indicating that buyers or sellers are losing control.
1. Head and Shoulders
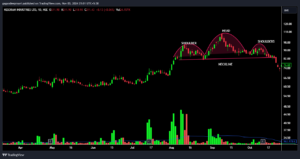
- Structure: Three peaks, with the middle peak (head) being the highest, flanked by two smaller peaks (shoulders).
- Psychology: This pattern reflects the exhaustion of an uptrend. The first peak shows strong buying interest, but after a slight dip, buyers make a stronger push (head). However, when the price drops again and attempts a third peak (right shoulder) that doesn’t reach the head’s height, it’s a sign that buying pressure is waning. Traders see this as a potential weakness in the trend, indicating that sellers may start to dominate.
- Application: A break below the neckline confirms that buyers are losing control, making it an ideal point for short positions.
2. Inverse Head and Shoulders
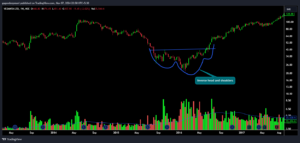
- Structure: A mirror image of the head and shoulders, with three troughs
- instead of peaks.
- Psychology: This pattern occurs when sellers are in control but begin to lose strength. The first dip (left shoulder) is significant, and though sellers push even lower (head), buyers start stepping in, creating a higher low (right shoulder). This shows that buyers are ready to take over, signifying a trend reversal.
- Application: Entry is often made on a break above the neckline, as this indicates that buyers are now likely to dominate.
3. Double Top
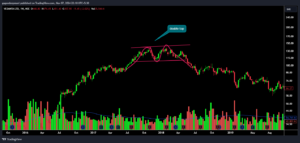
- Structure: Two peaks at approximately the same level.
- Psychology: The double top reflects waning buying enthusiasm. The first peak is met with a slight pullback, but buyers make another attempt to push higher. When they fail to surpass the previous high, it shows that bullish momentum is losing steam, signaling a potential reversal.
- Application: A drop below the intermediate low between the peaks confirms that sellers are taking control, often marking the start of a downtrend.
4. Double Bottom

- Structure: Two troughs at roughly the same level, creating a “W” shape.
- Psychology: This pattern forms when sellers try twice to push prices lower but fail both times. Each failure signals that the market is finding support and buyers are becoming stronger. When the price breaks above the intermediate peak between the lows, it suggests that buyer sentiment has shifted, indicating a bullish reversal.
- Application: Traders look for a breakout above the resistance level, suggesting that buyers are now driving the trend.
5. Triple Top
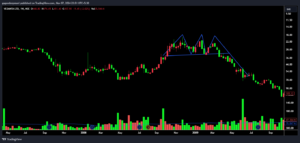
- Structure: Similar to a double top, but with three peaks at similar levels.
- Psychology: The triple top reflects an extended struggle between buyers and sellers, with buyers trying repeatedly to push higher but failing each time. After three unsuccessful attempts, it’s clear that buyers are losing momentum, leading sellers to gain confidence. This often results in a bearish trend reversal.
- Application: The pattern is confirmed when the price breaks below support, signaling that sellers have taken control.
6. Triple Bottom
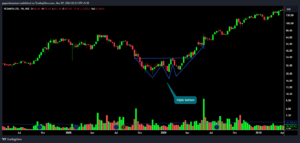
- Structure: Three troughs at the same level.
- Psychology: This pattern signals a strengthening support level. Sellers repeatedly attempt to push lower, but buyers step in each time. After the third attempt fails, buyers are likely to regain control, suggesting a reversal to the upside.
- Application: A break above the resistance level indicates that buyers are now in control, making this a bullish signal.
7. Rounding Bottom (Saucer Bottom)
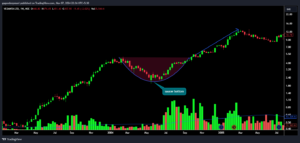
- Structure: A long, gradual curve that transitions from downtrend to uptrend.
- Psychology: The rounding bottom shows a slow shift from bearish to bullish sentiment. Initially, sellers dominate, pushing prices lower, but their enthusiasm gradually fades. As the curve rounds upward, buyers begin stepping in. This gradual transition reflects increased confidence in the uptrend.
- Application: Traders look for a breakout at the top of the saucer as a signal of a new uptrend.
8. Rounding Top (Saucer Top)
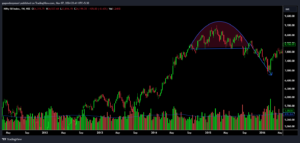
- Structure: The opposite of the rounding bottom, with a gradual curve that shifts from uptrend to downtrend.
- Psychology: The rounding top pattern reflects a gradual shift from bullish to bearish sentiment. Initially, buyers push prices higher, but their momentum slowly fades. Sellers gradually gain confidence, and the rounded structure suggests that bullish sentiment is weakening.
- Application: This pattern is confirmed as bearish when the price breaks down from the saucer’s bottom.
9. Falling Wedge (Reversal)
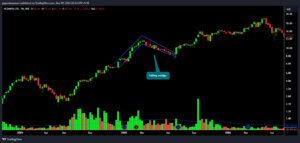
- Structure: A narrowing price range with lower highs and lower lows, sloping downward.
- Psychology: Although the trend is down, the falling wedge’s converging structure suggests that sellers are losing momentum. The pattern reflects a slow shift in control from sellers to buyers.
- Application: A breakout above the wedge’s resistance line signals a reversal, suggesting that buyers have gained control.
10. Rising Wedge (Reversal)
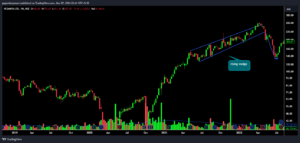
- Structure: Similar to the falling wedge but sloping upward, with converging highs and lows.
- Psychology: This pattern often appears in an uptrend and signals that buying pressure is waning. Buyers push the price higher, but each attempt becomes weaker. Sellers begin to gain confidence, and a breakdown below support suggests a bearish reversal.
- Application: A break below the wedge confirms the reversal, signaling an ideal entry for short positions.
Continuation Patterns: Supporting the Current Trend
Continuation patterns suggest that the current trend will likely resume after a brief period of consolidation or pullback. These patterns reflect a temporary pause in market action, after which the original trend often continues.
11. Bullish Flag
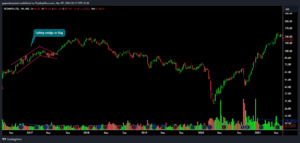
- Structure: A sharp upward movement (flagpole) followed by a rectangular consolidation.
- Psychology: The initial rally shows strong bullish sentiment, but the consolidation phase reflects a temporary pause as some traders take profits. However, the lack of significant downward movement suggests buyers still have control.
- Application: A break above the consolidation (flag) indicates that buyers are ready to continue the uptrend.
12. Bearish Flag
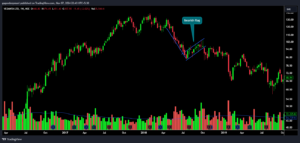
- Structure: A sharp downward movement followed by a rectangular consolidation.
- Psychology: Similar to the bullish flag but in a downtrend. The consolidation phase shows sellers taking a pause. The resumption of selling pressure after the flag’s break confirms the downtrend.
- Application: Enter a short position on a breakdown below the flag.
13. Bullish Pennant
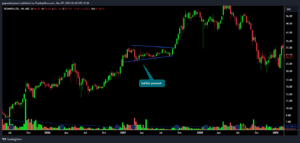
- Structure: A small, symmetrical triangle after a sharp upward move.
- Psychology: This pattern reflects a temporary pause in a bullish trend, with buyers regrouping. The subsequent breakout often signals a continuation of the bullish trend.
- Application: Buy on a breakout above the pennant.
14. Bearish Pennant
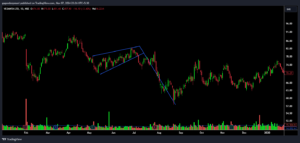
- Structure: A small symmetrical triangle after a sharp downward move.
- Psychology: The pennant suggests consolidation after a steep drop. The breakout below the pennant confirms that sellers remain in control.
- Application: Enter short on a break below the pennant.
15. Ascending Triangle
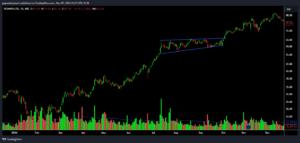
- Structure: A flat resistance line with an upward-sloping support line.
- Psychology: Buyers are pushing prices higher, consistently testing the resistance level. This signals growing buying interest, and the breakout above resistance often marks a continuation of the uptrend.
- Application: Buy on a confirmed breakout above resistance.
16. Descending Triangle
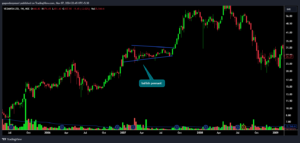
- Structure: A flat support line with a descending resistance line.
- Psychology: Sellers are pushing prices lower, testing support repeatedly. The final breakdown below support signals a continuation of the downtrend.
- Application: Sell on a confirmed break below support.
17. Symmetrical Triangle
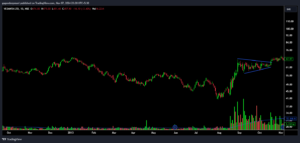
- Structure: Converging support and resistance lines.
- Psychology: This pattern reflects indecision, with neither buyers nor sellers in full control. The direction of the breakout generally determines the next trend.
- Application: Trade in the direction of the breakout.
18. Rectangle (Bullish)
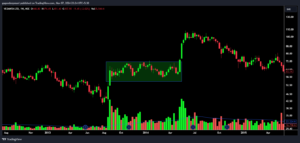
- Structure: Horizontal support and resistance, indicating a range-bound market.
- Psychology: Buyers and sellers are balanced, but a break above resistance usually signals a continuation of the previous uptrend.
- Application: Enter long on a breakout above resistance.
19. Rectangle (Bearish)
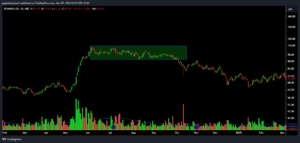
- Structure: Horizontal support and resistance in a downtrend.
- Psychology: Reflects balance between buyers and sellers, but a breakdown below support often signals a continuation of the downtrend.
- Application: Short on a break below support.
20. Cup and Handle
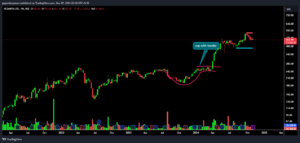
- Structure: A rounded bottom followed by a small consolidation.
- Psychology: This pattern reflects a gradual shift from bearish to bullish sentiment. The breakout from the handle suggests a resumption of the bullish trend.
- Application: Buy on a breakout from the handle.
Bilateral Patterns: Indicating Potential Movement in Either Direction
Bilateral patterns can break in either direction, requiring traders to be patient and follow the breakout for confirmation.
21. Symmetrical Triangle (Bilateral)
- Psychology: Reflects market indecision with neither side in control. The breakout direction indicates the new trend.
- Application: Trade in the breakout direction.
22. Broadening Formation
- Psychology: High volatility and uncertainty, with widening highs and lows reflecting competing forces.
- Application: Trade based on the breakout direction.
23. Diamond Top
- Psychology: Reflects exhaustion and indecision, with sellers often taking control after a breakdown.
- Application: Enter short on a confirmed breakdown.
24. Diamond Bottom
- Psychology: Signals a gradual shift from seller to buyer control at market bottoms.
- Application: Go long on a breakout.
25. Megaphone Pattern
- Psychology: Shows high volatility with increasing highs and lows. The breakout direction determines the next trend.
- Application: Trade in the breakout direction.
Conclusion
Understanding the psychology behind each pattern provides deeper insights into market behavior and helps traders anticipate potential moves. Apply this knowledge to make better-informed trading decisions and improve your trading outcomes. For more on market analysis, visit Mavi Analytics Blog.


 Update: Nov 07, 2024
 8 mins
read